- Overview
- Summary
- Learning Objectives
- Data
- The rise of the Data Analyst
- Data Analysis Steps
- What is Data Preprocessing?
- Why Data Preprocessing is important
- Why do you learn Data Preprocessing?
- Major Tasks in Data Preprocessing
- Why you learn this subject using R?
- Introduction to R and RStudio IDE
- R Studio Cheatsheets
- R Studio on RMIT MyDesktop
- R Studio Cloud
- R Programming Basics
- Additional Resources and Further Help in R
- References
Module 1
Data Preprocessing: From Raw Data to Ready to Analyse
Overview
Summary
Module 1 will set the background for the entire course. Data preprocessing will be defined and the importance of data preprocessing inside the data analysis workflow will be explored. The module will define 5 major tasks for data preprocessing and will provide a quick overview of these tasks. Then, in the following modules of this course, we will unwrap each data preprocessing task by providing details of operations related to that task. I will also introduce you to R in this module, discuss the benefits it provides, and start to get you comfortable with R by giving R and RStudio basics. Recommended reading and useful online resources to get started with R will be given at the end of this module.
Learning Objectives

The learning objectives of this module are as follows:
- Define data preprocessing.
- Identify steps for data analysis, understand the place of data preprocessing inside the data analysis workflow.
- Understand the reasons why data preprocessing is important.
- Identify major tasks in data preprocessing.
- Understand main benefits of using R statistical programming language in data preprocessing.
- Learn how to install R and RStudio, know the overview of the RStudio interface.
- Know how to install and load packages.
- Learn mathematical/logical operations and basic programming in R.
- Know how to get further help for R statistical programming language.
Data
“Data! Data! Data! I can’t make bricks without clay!” - Sir Arthur Conan Doyle.
Data. Our world has turned out to be increasingly dependent upon this resource. Sir Conan Doyle’s famous detective, Sherlock Holmes, wouldn’t shape any theories or draw any conclusions unless he had adequate data. Data is the fundamental building piece of all that we do in analytics such as the analyses we perform, the reports we build, and the decisions we made.
The rise of the Data Analyst
Today’s organizations have access to more data than ever before, but more data isn’t better data unless you know what to do with it. Organizations are struggling to find people who can turn their data into insights and value, which in turn has created a high demand across the world for data analysts. During an interview in 2009, Google’s Chief Economist Dr. Hal R. Varian stated, “The ability to take data - to be able to understand it, to process it, to extract value from it, to visualize it, to communicate it - that’s going to be a hugely important skill in the next decades.” Read the full article here
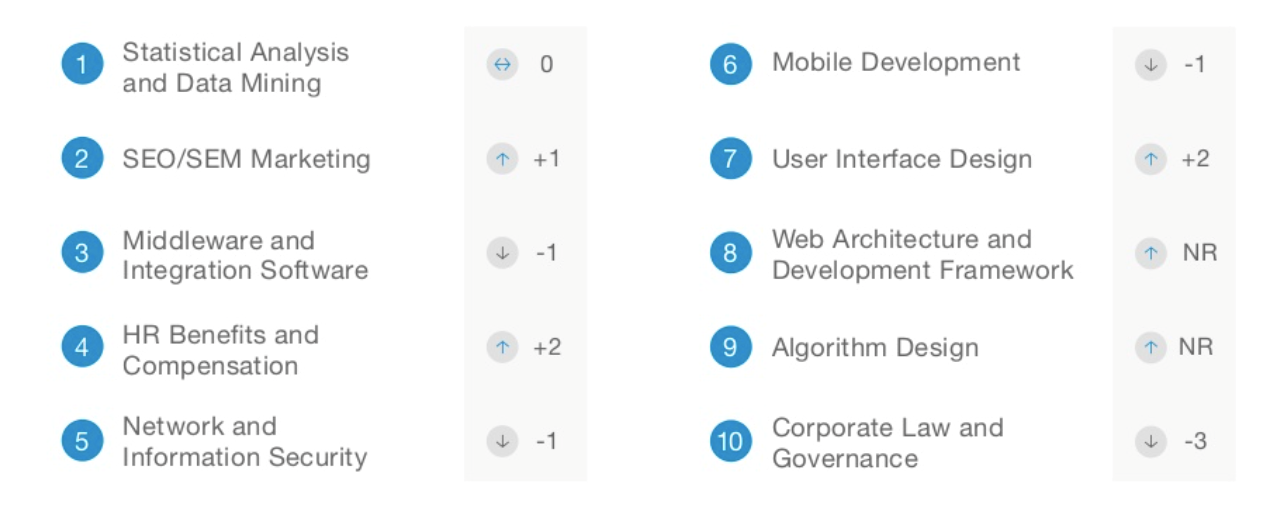
Moreover, LinkedIn reported that the “data analysis” is one of the hottest skill categories over the past years for recruiters, and it was the only category that consistently ranked in the top 4 across all of the countries they analysed. Read the full article here. Below are the top ten skills reported on LinkedIn for Australia.

According to a recent IBM report (Read the full article here):
- 59% of all data science and analytics job demand is in Finance and Insurance, Professional Services, and IT.
- By 2020, the number of data science and analytics job listings is projected to grow by nearly 364,000 listings to approximately 2,720,000.
- 39% of data scientists and advanced analyst positions require a master’s or Ph.D. in the related area.
Consequently, it is safe to say that skilled data analysts are now crucial to all industries. There is a need for becoming fluent in the data analysis process and staying up to date by continually learning and adding new knowledge in this field. I am assuming that’s the reason why you are here!
Data Analysis Steps
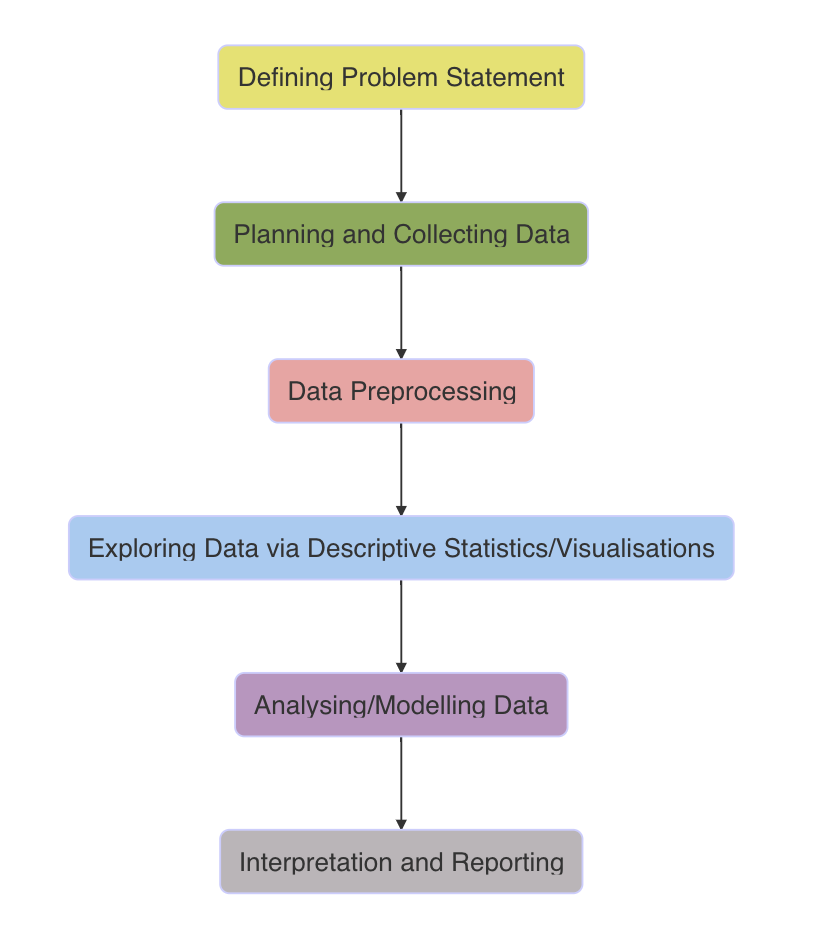
The statistical approach to data analysis is much broader than just analysing data. Data analysis process starts with defining problem statement, continues with planning and collecting data, preprocessing data, exploring data using descriptive statistics and data visualizations, analysing/modelling data, and finalizes with interpreting and reporting findings. This process is depicted in the following illustration.

Defining Problem Statement: This is the first step of data analysis. In this step, the problem statement is identified by the organizations/researchers. The data analyst should thoroughly understand the problem and the domain of the problem.
Planning and Collecting Data: In this step, the appropriate tools for data collection related to the problem statement will be identified. This step may include designing a survey for data collection, scraping data from web or accessing an Excel/a database file.
Data Preprocessing: The objective of this step is to make the data ready for the further statistical analysis. This step is one of the important phases in data analysis. The accuracy of the statistical analysis depends on the quality of the data gained in this step. Several operations such as importing data, reshaping data from long to wide format, filtering data, cleaning data, identifying outliers, and transforming variables can be applied to the data to make ready for the statistical analysis.
Exploring Data via Descriptive Statistics/Visualizations: The objective of this step is to understand the main characteristics of the data. Exploratory analyses are generally done using descriptive statistics (i.e. mean, median, standard deviation, frequencies, percentages etc.) and visualization tools (i.e. scatter plots, box plots, histograms, interactive data visualizations etc.). Exploratory analysis will show you the things that you didn’t expect or raise new questions about the data.
Analysing/Modelling Data: The statistical analysis/modelling step can include a broad range of techniques like statistical hypothesis testing, statistical modelling, and machine learning algorithms. Generally, the type of the variables in the data set and the purpose of the investigation will determine the appropriate analysis technique.
Interpretation and Reporting: The last step of the data analysis is the reporting and the interpretation of the results. This step is also critical as if you cannot understand and communicate your results to others, it doesn’t matter how well you conducted your analysis.
What is Data Preprocessing?
Most statistical theory concentrates on data modelling, prediction, and statistical inference while it is usually assumed that data are in the correct state for the data analysis. However, in practice, a data analyst spends most of his/her time (usually 50%-80% of an analyst time) on making ready the data before doing any statistical operation (Dasu and Johnson (2003)). Despite the amount of time it takes, there has been surprisingly very little emphasis on how to preprocess data well (Wickham et al. (2014)) and (Wickham, Çetinkaya-Rundel, and Grolemund (2023)). Real-world data are commonly incomplete, noisy, inconsistent, and don’t have all the correct labels and codes that are required for the analysis. Data Preprocessing, which is also commonly referred to as data wrangling, data manipulation, data cleaning, etc., is a process and the collection of operations needed to prepare all forms of untidy data (incomplete, noisy and inconsistent data) for statistical analysis.
Why Data Preprocessing is important

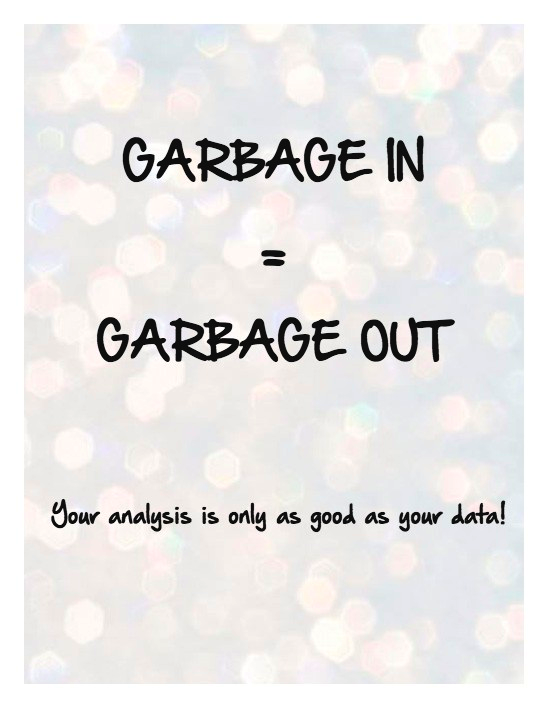
Data preprocessing may significantly influence the statistical conclusions based on the data. “Garbage in, garbage out (GIGO)” is a famous saying that is used to emphasis “the quality of the statistical analyses (output) always depends on the quality of the data (input)”. By preprocessing data, we can minimise the garbage that gets into our analysis so that we can minimise the amount of garbage that our analyses/models result.
Why do you learn Data Preprocessing?
The road to becoming an expert in data analysis can be challenging and in fact, obtaining expertise in the broad range of data analysis is a career-long process. In this course, you will take a step closer to fluency in the early stages; namely in the data preprocessing step, as you need to be able to import, manage, manipulate and transform your data before performing any kind of data analysis.
Major Tasks in Data Preprocessing
We will define 5 major tasks for data preprocessing framework, namely: Get, Understand, Tidy & Manipulate, Scan and Transform.
A typical data preprocessing process usually (but not necessarily)
follows the following order of tasks given below:

Get: A data set can be stored in a computer or can be online in different file formats. We need to get the data set into R by importing it from other data sources (i.e., .txt, .xls, .csv files and databases) or scraping from web. R provides many useful commands to import (and export) data sets in different file formats.
Understand: We cannot perform any type of data preprocessing without understanding what we have in hand. In this step, we will check the data volume (i.e., the dimensions of the data) and structure, understand the variables/attributes in the data set, and understand the meaning of each level/value for the variables.
Tidy & Manipulate: In this step, we will apply several important tasks to tidy up messy data sets. We will follow Hadley Wickham’s “Tidy Data” principles:
Each variable should have its own column.
Each observation should have its own row.
Each value should have its own cell.
We may also need to manipulate, i.e. filter, arrange, select, subset/split data, or generate new variables from the data set.
Scan: This step will include checking for plausibility of values, cleaning data for obvious errors, identifying and handling outliers, and dealing with missing values.
Transform: Some statistical analysis methods are sensitive to the scale of the variables and it may be necessary to apply transformations before using them. In this step we will introduce well-known data transformations, data scaling, centering, standardising and normalising methods.
There are also other steps related with preprocessing special types of data including dates, time and characters/strings. The last module of this course will introduce the special operations used for date, time and text preprocessing.
Why you learn this subject using R?
In this course, you won’t learn anything about Excel, SPSS, SQL, SAS, Python, Julia, or any other statistical package/programming language useful for data preprocessing. This isn’t because I think that these tools are bad or redundant. They’re not. In practice, most data analytics teams use a mixture of these tools and programming languages. I strongly believe that R is a great place to start your data analysis journey as it is a comprehensive language for data analysis. You can use R effectively in almost each step of data analysis, from data collection to reporting. You can collect, preprocess, visualise and analyse your data using R functions, report and publish your findings using RMarkdown.
Since any typical data preprocessing actions like missing value imputation or outlier handling obviously influence the results of statistical analyses, data preprocessing should be viewed as a statistical operation and should be performed in a reproducible way. The R software provides us a good environment for reproducible data preprocessing as all actions can be scripted and therefore reproduced. Moreover, through the Master of Analytics and Master of Statistics & Operations Research programs, you will learn many data analysis subjects (i.e., Introduction to Statistics, Data Visualisation, Machine Learning, Analysis of Categorical Data, Time Series Analysis, Forecasting and Applied Bayesian Analysis courses) using R environment. So, it is better to use the same tool for data preprocessing as well.
Introduction to R and RStudio IDE
There are many reasons why R is a good solution for the problems that are covered in this course. According to Munzert et al. (2014), the most important points are:
R is freely and easily accessible. You can download, install, and use it wherever and whenever you want.
For a software environment with a primarily statistical focus, R has a large community that continues to flourish. R is used by various disciplines, such as social scientists, medical scientists, psychologists, biologists, geographers, linguists, and in business.
R is open source. This means that you can easily retrace how functions work and modify them with little effort.
R is reasonably fast in ordinary tasks.
R is powerful in creating data visualizations. Although this not an obvious plus for data collection, you would not want to miss R’s graphics facilities in your daily workflow.
Work in R is mainly command line based. This might sound like a disadvantage to R rookies, but it is the only way to allow to produce reproducible results compared to point-and-click programs.
R is not picky about operating systems. It can generally be run under Windows, Mac OS, and Linux.
Finally, R is the entire package from start to finish.
Both R and RStudio run on Windows, Linux and Mac. Install R first and then install RStudio.
R: Windows, Linux and Mac: http://cran.ms.unimelb.edu.au/
RStudio: Windows, Linux and Mac: http://www.rstudio.com/products/rstudio/download/
Once installed, load RStudio. RStudio is an integrated development environment (IDE) for R. It will allow you to use R in a more efficient manner. RStudio provides the user with a streamlined user interface and access to many powerful tools to make working with R more efficient.
R Studio Cheatsheets
Some popular packages can be found R Studio Cheatsheets.
R Studio on RMIT MyDesktop
R and RStudio are both available via the RMIT MyDesktop. This allows you to use R on any portable computing device with a WiFi and Internet connection. It also allows you to run R without installing it on your computer.
After accessing MyDesktop, wait a few minutes and search for “RStudio” after clicking on the Windows button. If you are having trouble accessing MyDesktop or RStudio through MyDesktop, contact RMIT IT Service Desk.
R Studio Cloud
RStudio Cloud is a hosted
version of RStudio in the cloud that makes it easy for professionals,
trainers, teachers and students to do, share, teach and learn data
science using R. RStudio Cloud directly works from your browser, there
is no software to install and nothing to configure on your
computer.
RStudio Cloud is especially useful if you are having trouble
in installing/running R and RStudio in your local computer.
Always the latest version of R is used in RStudio Cloud and it is ready
to go anywhere anytime. Only requirement to use R Studio cloud is to
have an internet connection. RStudio Cloud is currently free to use.
Free version requires you to sign-in with your Google account as
follows:
Visit RStudio Cloud website here.
Click on “Log in”.
Select “Log in with your Google account” option. Enter your Google account credentials and proceed.
That’s it! Now you are in the RStudio Cloud which has the latest R installed already.
Create a new project by clicking on “New Project”. This is where your experiment with your code.
Here is the guide to
using RStudio Cloud.
RStudio Cloud also provides many learning materials: interactive tutorials covering the basics of data science and cheatsheets for working with popular R packages.
R Programming Basics
You can also see R Bootcamp. There are some course in R Bootcamp that you can complete them. They will introduce you to the basics of R and RStudio environment, and you will learn to:
- Install R and RStudio.
- Access RStudio from MyDesktop.
- Have an overview of the RStudio interface.
- Install and load packages.
- Learn mathematical/logical operations.
- Learn basic programming in R.
Additional Resources and Further Help in R
There are lots of amazing things that you can do with R and RStudio. Here are my favourite links to help you learn more:
R for Data Science: The online (and free!) book “R for Data Science” by Garrett Grolemund and Hadley Wickham, published by O’Reilly, January 2017. Its edited version is available HERE. This is also one of the recommended textbooks for our course.
R Packages: The online book “R Packages” by Wickham, Hadley, and Jennifer Bryan.
R Programming for Data Science: The online (and free!) book “R Programming for Data Science” by Roger D. Peng.
R Cheatsheets: RStudio cheat sheets make it easy to learn about and use some of the favourite packages.
Rseek: A custom search engine for R related resources created and maintained by Sasha Goodman.
R-bloggers: R news and tutorials contributed by (750) R bloggers.
swirl: Learn R, in R. Swirl teaches you R programming and data science interactively, at your own pace, and right in the R console.
DataCamp: Free hands-on courses on R programming.
Quick-R web page: A comprehensive web site including R tutorials on basic and advanced statistics.
R Help pages: R has a very powerful but complicated help file achieve. If you don’t know how to use a function, you can search it by typing
help()(e.g.,help(mean)) in the console and this will display the help files (e.g., associated withmean()function).RStudio Community: This is a warm and welcoming place to ask any questions you might have about the R and RStudio.
Google and Stack Exchange: Sometimes what you really need to see are some examples. You can ask your question to Google or Stack Exchange. Just add “with R” at the end of any search. There is a huge community there willing to help when you have issues.