Module 4.2 Demonstration
Tidy & Manipulate: Part II - Manipulate
Recall: Tidy Data Principles
Previous week:
- The framework of "Tidy Data Principles" provides a standard and consistent way of storing data that makes transformation, visualization, and modeling easier.

Recall: Tidy Data Principles
Previous week:
- The framework of "Tidy Data Principles" provides a standard and consistent way of storing data that makes transformation, visualization, and modeling easier.

Each variable must have its own column.
Each observation must have its own row.
Each value must have its own cell.
Recall: tidyr
tidyris a one such package which was built for the sole purpose of simplifying the process of creating tidy data.Following tidy principles makes manipulation, transformation, visualization, and modeling easier.
tidyverse is a set of packages that work in harmony because they share common data representations and API design.

haven, for importing spss sas .. data ggplot2 for visualization purr, for functional programming modelr, for simple modeling within a pipeline broom, for turning models into tidy data knitr, for report generation rmarkdown, turn your analysis into anything
The grammar of Data Manipulation: dplyr
There are many data manipulation packages/functions in R.
Most of them lack consistent coding and the ability to easily flow together.
This leads to difficult-to-read nested functions and/or choppy code.
The grammar of Data Manipulation: dplyr
There are many data manipulation packages/functions in R.
Most of them lack consistent coding and the ability to easily flow together.
This leads to difficult-to-read nested functions and/or choppy code.
The
dplyrpackage is regarded as the "Grammar of Data Manipulation" in R.It provides a consistent set of verbs that help you solve the most common data manipulation challenges.
Remember:
dplyrfunctions work with pipes %>% and expect tidy data .
The grammar of Data Manipulation: dplyr
There are six fundamental functions of data manipulation that
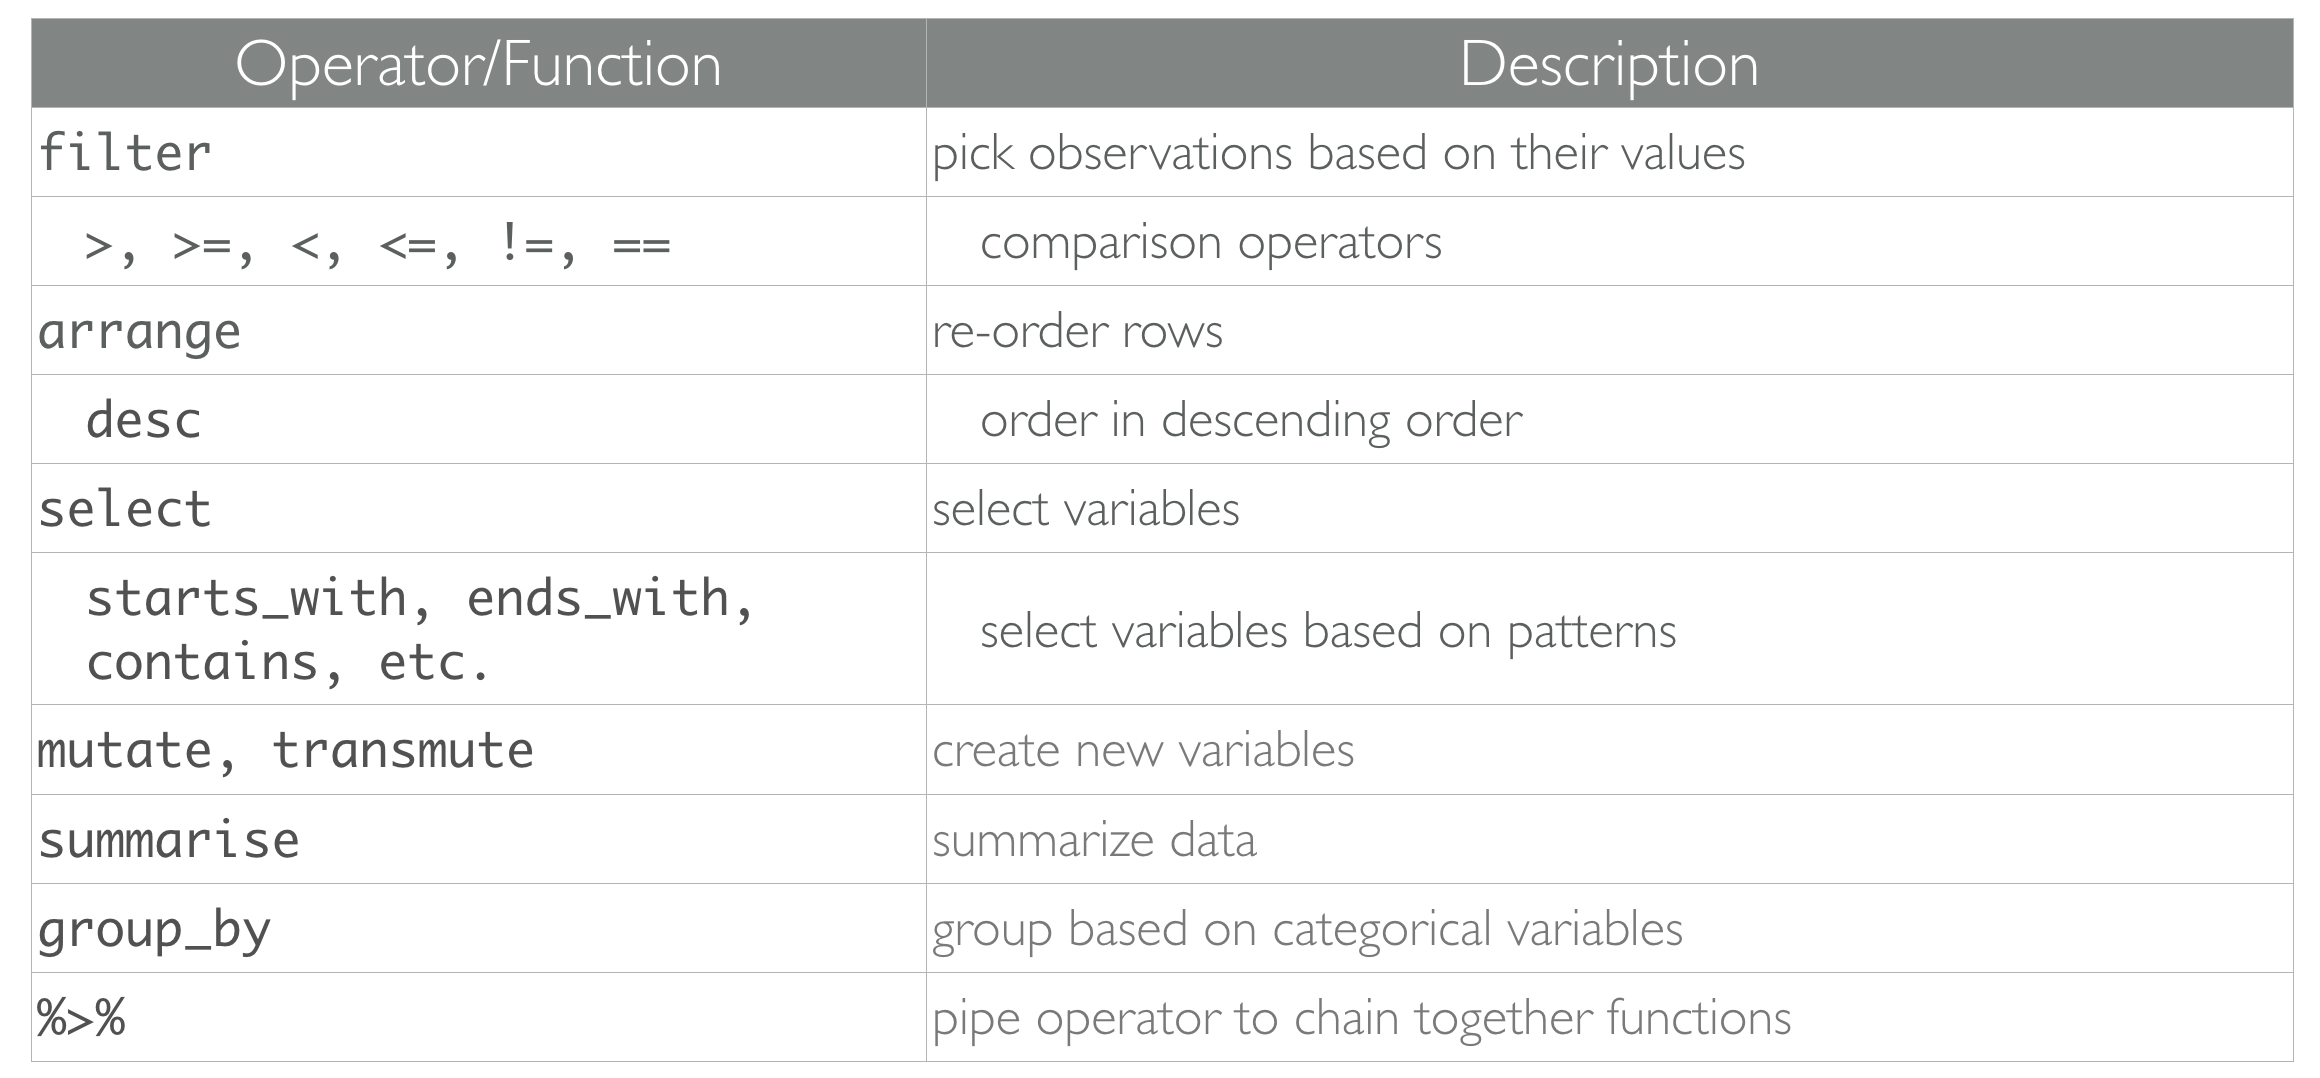
dplyrprovides:select()pick/select variablesfilter()pick/filter observations based on valuesarrange()sort variablesmutate()create new variablessummarise()summarise data by functions of choicegroup_by()+summarise()
There are also functions to join and merge data sets:
- Mutating joins
- Filtering joins
- Set operations
- Merging data sets
The full list of capabilities can be found in the dplyr reference manual.
I highly recommend going through it as there are many great functions provided by
dplyrthat will not cover here.
select() : select variables
Often we only assess specific variables. The
select()function allows us to select variables.In addition to the existing functions like
:andc(), there are a number of special functions that can work inside select.
| Functions | Usage |
|---|---|
- |
Select everything but |
: |
Select range |
contains() |
Select columns whose name contains a character string |
starts_with() |
Select columns whose name starts with a character string |
ends_with() |
Select columns whose name ends with a string |
everything() |
Select every column |
matches() |
Select columns whose name matches a regular expression |
num_range() |
Select columns named ... |
one_of() |
Select columns whose names are in a group of names |
Import Customer Data
- The CustomerData.csv data set includes some characteristics of 5000 customers. Header of this data set is as follows.
customer <- read.csv("../data/CustomerData.csv")head(customer[, 1:7], 5)## CustomerID Region TownSize Gender Age EducationYears JobCategory## 1 3964-QJWTRG-NPN 1 2 Female 20 15 Professional## 2 0648-AIPJSP-UVM 5 5 Male 22 17 Sales## 3 5195-TLUDJE-HVO 3 4 Female 67 14 Sales## 4 4459-VLPQUH-3OL 4 3 Male 23 16 Sales## 5 8158-SMTQFB-CNO 2 2 Male 26 16 SalesActivity: select()
Which of the following can be used to:
Q1. select all variables between
CustomerIDandGender.Q2. select all variables other than those between
CustomerIDandGender.Q3. select CustomerID and all variables that contain the word "Card".
Q1. Select all variables between CustomerID and Gender.
select(customer, CustomerID:Gender)#customer %>% select(CustomerID:Gender)Q2. Select all variables except for those between CustomerID and Gender.
select(customer, -(CustomerID:Gender))Q3. Select CustomerID and all variables that contain the word "Card".
select(customer, CustomerID, contains("Card"))filter(): filter observations based on values
filter()identifies or selects observations in which a particular variable matches a specific value/condition.The condition(s) can be any kind of logical comparison and Boolean operators, such as:
| Symbol | Usage |
|---|---|
< |
Less than |
> |
Greater than |
== |
Equal to |
<= |
Less than or equal to |
>= |
Greater than or equal to |
!= |
Not equal to |
%in% |
Group membership |
is.na |
Is NA |
| Symbol | Usage |
|---|---|
!is.na |
Is not NA |
&, I |
Boolean AND, OR |
xor |
exclusive or |
! |
not |
any |
any true |
all |
all true |
Activity: filter()
Which of the following can be used to:
Q4. filter for female customers only.
Q5. filter for female customers that are greater than 45 years old AND live in region 3.
Q6. filter for female customers that are greater than 45 years old OR live in region 3.
Q4: Filter for female customers only.
filter(customer, Gender == "Female")Q5: Filter for female customers that are greater than 45 years old and live in region 3.
filter(customer, Gender == "Female", Age > 45, Region == 3)Q6: Filter for female customers that are greater than 45 years old or live in region 3.
filter(customer, Gender == "Female", Age > 45 | Region == 3)arrange(): order data by variables
arrange()orders the data by variables in ascending (default) or descending order.For a descending order, use
desc()within thearrange()function.
Activity: arrange()
Which of the following can be used to:
Q7: select the variables
CustomerID,Region,Gender,Age,HHIncome,CardSpendMonthand save this assub_cust.Q8: order
sub_custdata byAgeandCardSpendMonth(ascending order).Q9: order
sub_custdata byAge(oldest to youngest) andCardSpendMonth(least to most).
Q7: Select variables.
sub_cust <- select(customer, CustomerID, Region, Gender, Age, HHIncome, CardSpendMonth)Q8: Order sub_cust data by Age and CardSpendMonth (ascending order).
arrange(sub_cust, Age, CardSpendMonth)Q9: Order sub_cust data by Age (oldest to youngest) and CardSpendMonth (least to most).
arrange(sub_cust, desc(Age), CardSpendMonth)mutate(): create new variables
mutate()adds new variables while preserving the existing variables.transmute()creates a new variable and then drops the other variables.Here is the list of some useful functions used inside the
mutate().
| Functions | Usage |
|---|---|
pmin(), pmax() |
Element wise min and max |
cummin(), cummax() |
Cumulative min and max |
cumsum(), cumprod() |
Cumulative sum and product |
between() |
Are values between a and b? |
cume_dist() |
Cumulative distribution of values |
cumall(), cumany() |
Cumulative all and any |
cummean() |
Cumulative mean |
Activity: mutate()
Which of the following can be used to:
Q10: create a ratio variable that computes the ratio of
CardSpendMonthtoHHIncomeusingsub_custdata.Q11: create two variables: ratio1 = CardSpendMonth / HHIncome and ratio2 = CardSpendMonth / Age.
Q10: Create a ratio variable that computes the ratio of CardSpendMonth to HHIncome.
mutate(sub_cust, ratio = CardSpendMonth / HHIncome)Q11: Create 2 variables.
mutate(sub_cust, ratio1 = CardSpendMonth / HHIncome, ratio2 = CardSpendMonth / Age)summarise(): summarise data by functions of choice
summarise()(orsummarize()) performs the majority of summary statistics.
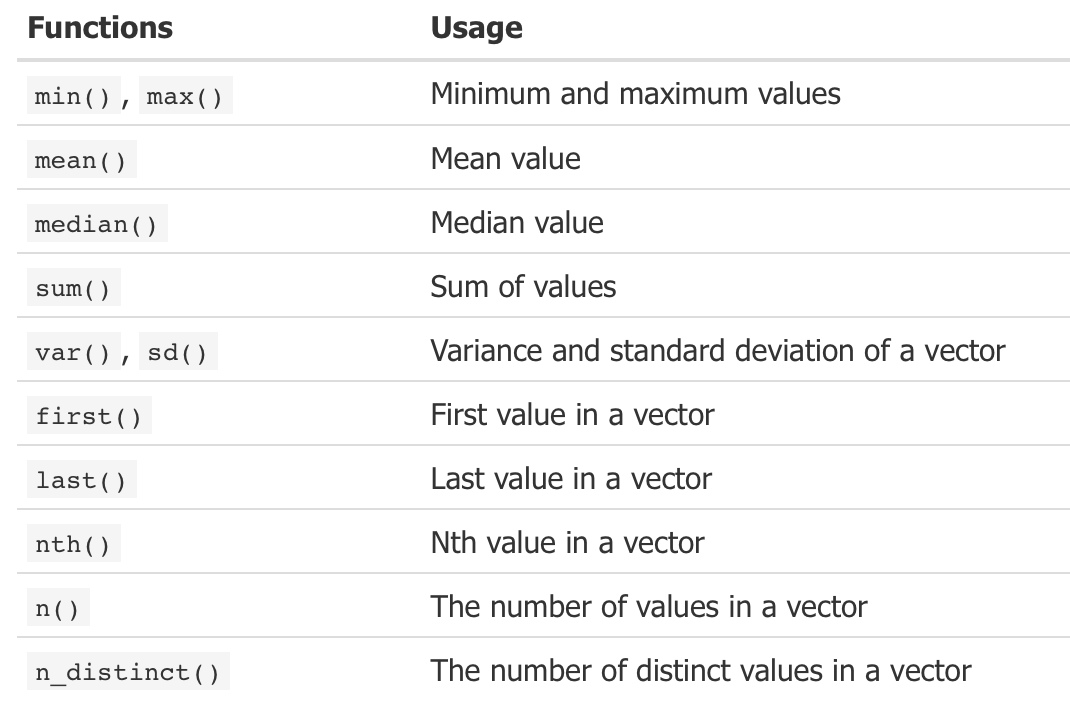
- All functions in this list takes a vector of values and returns a single summary value.
group_by() + summarise() function
If we want to take the summary statistics grouped by a variable, then we need to use another function called
group_by().group_by()along withsummarise()functions will allow us to take and compare summary statistics grouped by another (usually factor) variable.
Activity: group_by() + summarise()
Which of the following can be used to:
Q12: compute the average
CardSpendMonthacross all customers in our sub_cust data.Q13: compute the average
CardSpendMonthfor eachGender.Q14: compute the average
CardSpendMonthfor eachGenderandRegion.
Q12: Avg spend across all customers.
summarize(sub_cust, Avg_spend = mean(CardSpendMonth, na.rm = TRUE))Q13: Compute the average CardSpendMonth for each gender.
by_gender <- group_by(sub_cust, Gender)summarize(by_gender, Avg_spend = mean(CardSpendMonth, na.rm = TRUE))Q14 : Compute the average CardSpendMonth for each gender and region.
by_gdr_rgn <- group_by(sub_cust, Gender, Region)avg_gdr_rgn <- summarize(by_gdr_rgn, Avg_spend = mean(CardSpendMonth, na.rm = TRUE))arrange(avg_gdr_rgn, desc(Avg_spend))Relational data sets
Often we have separate data frames that can have common and differing variables for similar observations (relational data sets).
Take a look at these toy data sets (i.e. band members of the Beatles and Rolling Stones):
band_members## # A tibble: 3 × 2## name band ## <chr> <chr> ## 1 Mick Stones ## 2 John Beatles## 3 Paul Beatlesband_instruments## # A tibble: 3 × 2## name plays ## <chr> <chr> ## 1 John guitar## 2 Paul bass ## 3 Keith guitarJoining data sets
dplyroffers three sets of joining functions to provide alternative ways to join data frames.Mutating joins: add new variables to one data frame from matching observations in another.
Filtering joins: filter observations from one data frame based on whether or not they match an observation in the other table.
Set operations: treat observations as if they were set elements.
Merging data sets: merge data frames by row and column.
Mutating joins
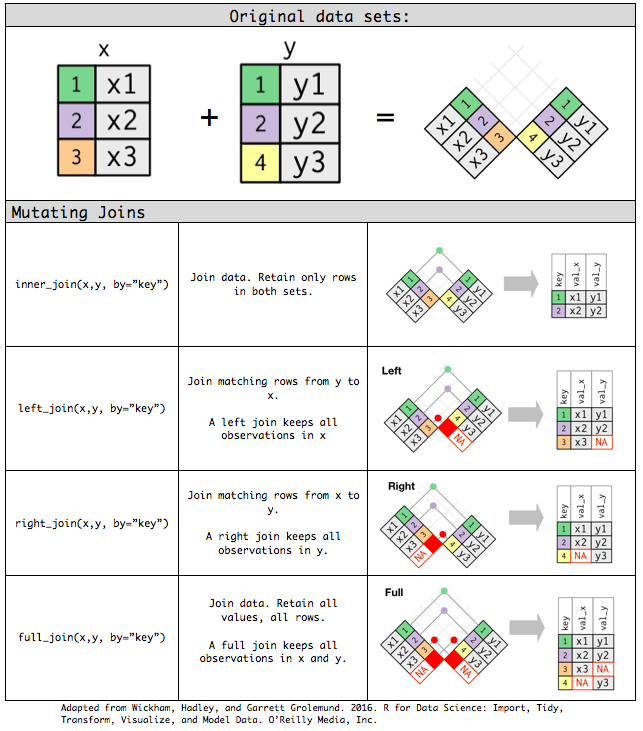
inner_join(): only retains rows in both datasets.left_join(): prioritizes left dataset.right_join(): prioritizes right dataset.full_join(): retains all rows.
Each mutating join takes an argument
bythat controls which variables are used to match observations in the two data sets.dplyrwill use all variables that appear in both tables, a natural join (NULL: default value/key).
Mutating joins
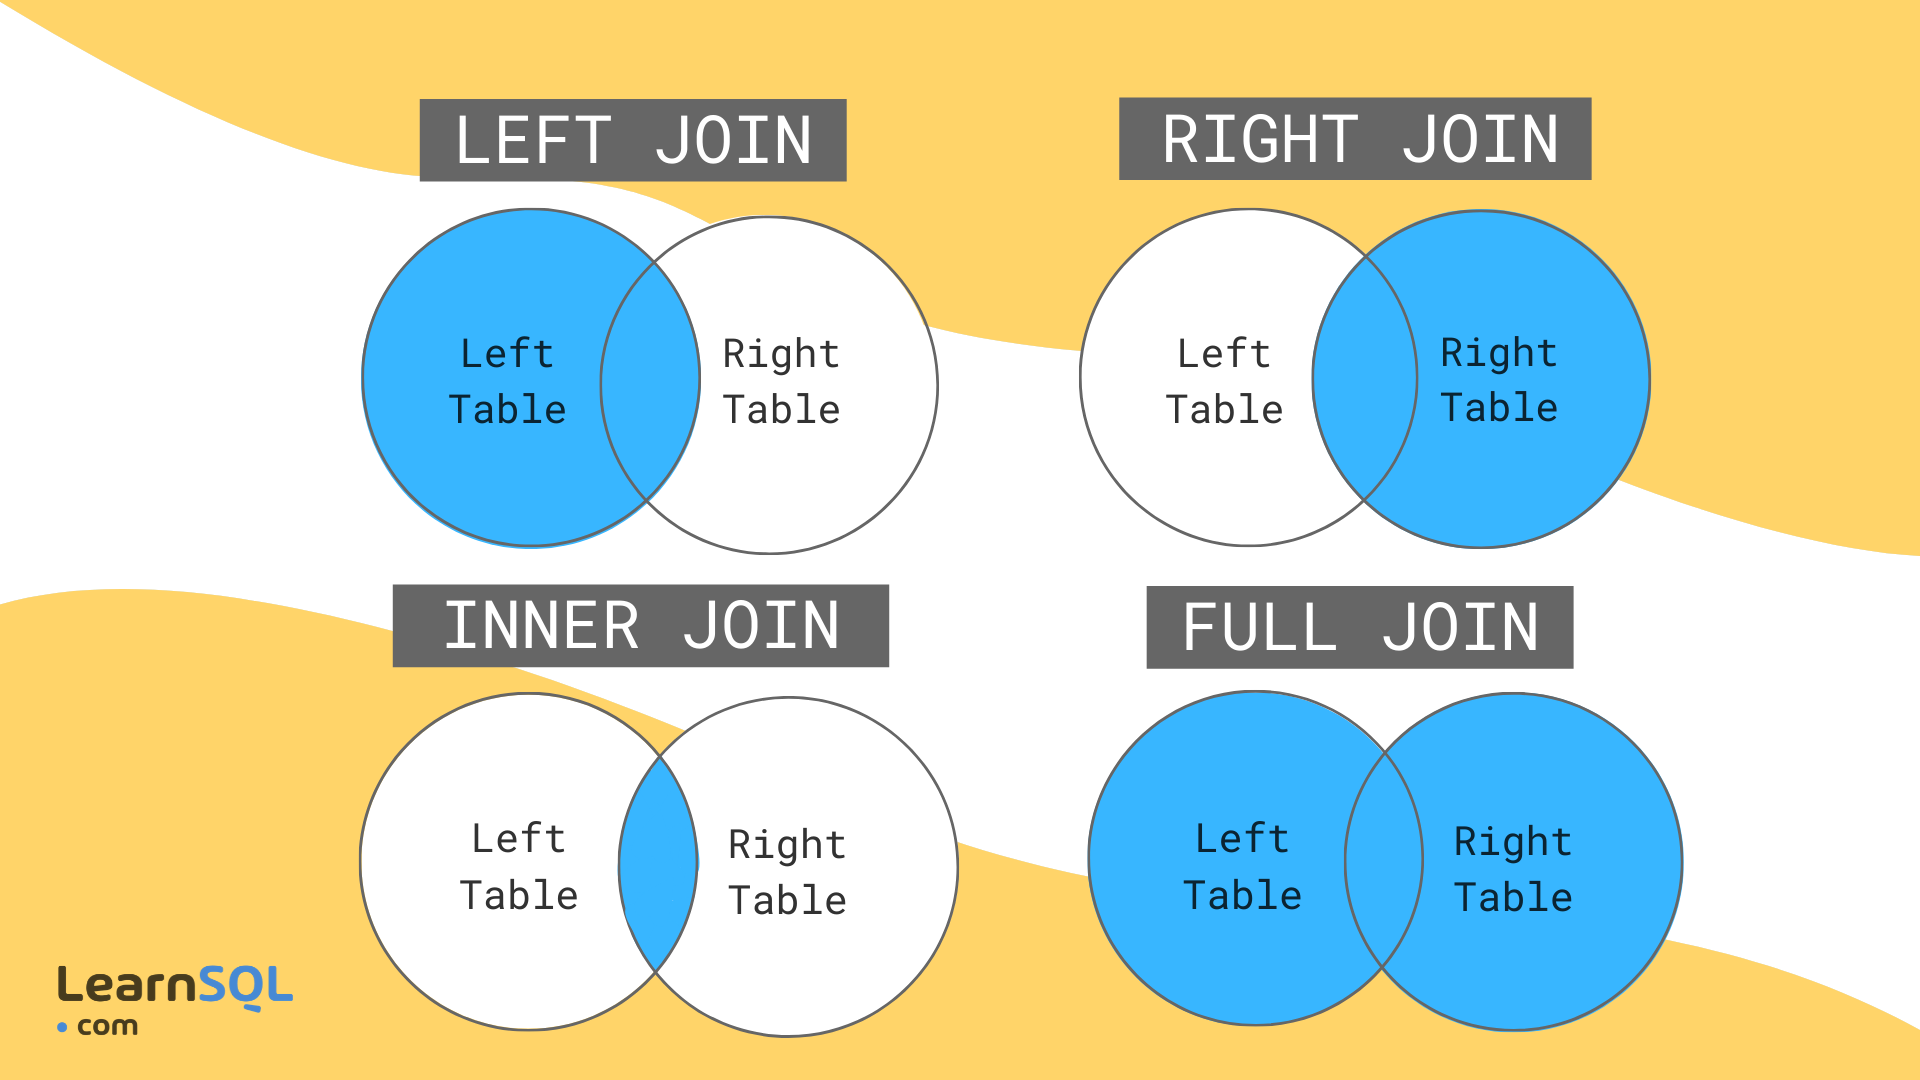
Example: Mutating joins
band_members## # A tibble: 3 × 2## name band ## <chr> <chr> ## 1 Mick Stones ## 2 John Beatles## 3 Paul Beatlesband_instruments## # A tibble: 3 × 2## name plays ## <chr> <chr> ## 1 John guitar## 2 Paul bass ## 3 Keith guitar- PRESS P
band_members %>% inner_join(band_instruments) #only retains rows in both datasets## Joining with `by = join_by(name)`## # A tibble: 2 × 3## name band plays ## <chr> <chr> <chr> ## 1 John Beatles guitar## 2 Paul Beatles bassband_members %>% left_join(band_instruments) #prioritizes left dataset## Joining with `by = join_by(name)`## # A tibble: 3 × 3## name band plays ## <chr> <chr> <chr> ## 1 Mick Stones <NA> ## 2 John Beatles guitar## 3 Paul Beatles bassband_members %>% right_join(band_instruments) #prioritizes right dataset## Joining with `by = join_by(name)`## # A tibble: 3 × 3## name band plays ## <chr> <chr> <chr> ## 1 John Beatles guitar## 2 Paul Beatles bass ## 3 Keith <NA> guitarband_members %>% full_join(band_instruments) #retains all rows## Joining with `by = join_by(name)`## # A tibble: 4 × 3## name band plays ## <chr> <chr> <chr> ## 1 Mick Stones <NA> ## 2 John Beatles guitar## 3 Paul Beatles bass ## 4 Keith <NA> guitarFiltering joins
semi_join(x, y): keeps all observations in x that have a match in y.anti_join(x, y): drops all observations in x that have a match in y.
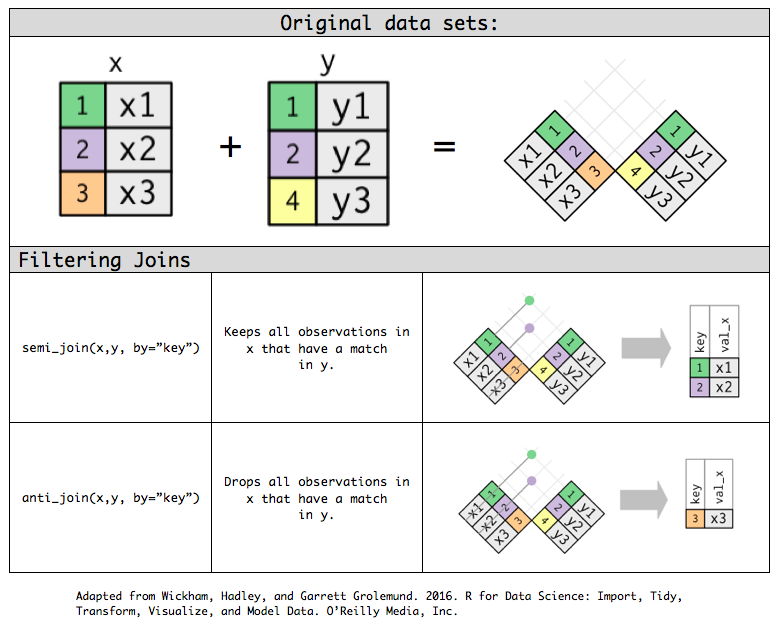
Example: Filtering joins
band_members## # A tibble: 3 × 2## name band ## <chr> <chr> ## 1 Mick Stones ## 2 John Beatles## 3 Paul Beatlesband_instruments## # A tibble: 3 × 2## name plays ## <chr> <chr> ## 1 John guitar## 2 Paul bass ## 3 Keith guitar- PRESS P
band_members %>% semi_join(band_instruments) #keeps all observations in members that have a match in instruments## Joining with `by = join_by(name)`## # A tibble: 2 × 2## name band ## <chr> <chr> ## 1 John Beatles## 2 Paul Beatlesband_members %>% anti_join(band_instruments) #drops all observations in members that have a match in instruments## Joining with `by = join_by(name)`## # A tibble: 1 × 2## name band ## <chr> <chr> ## 1 Mick StonesSet operations
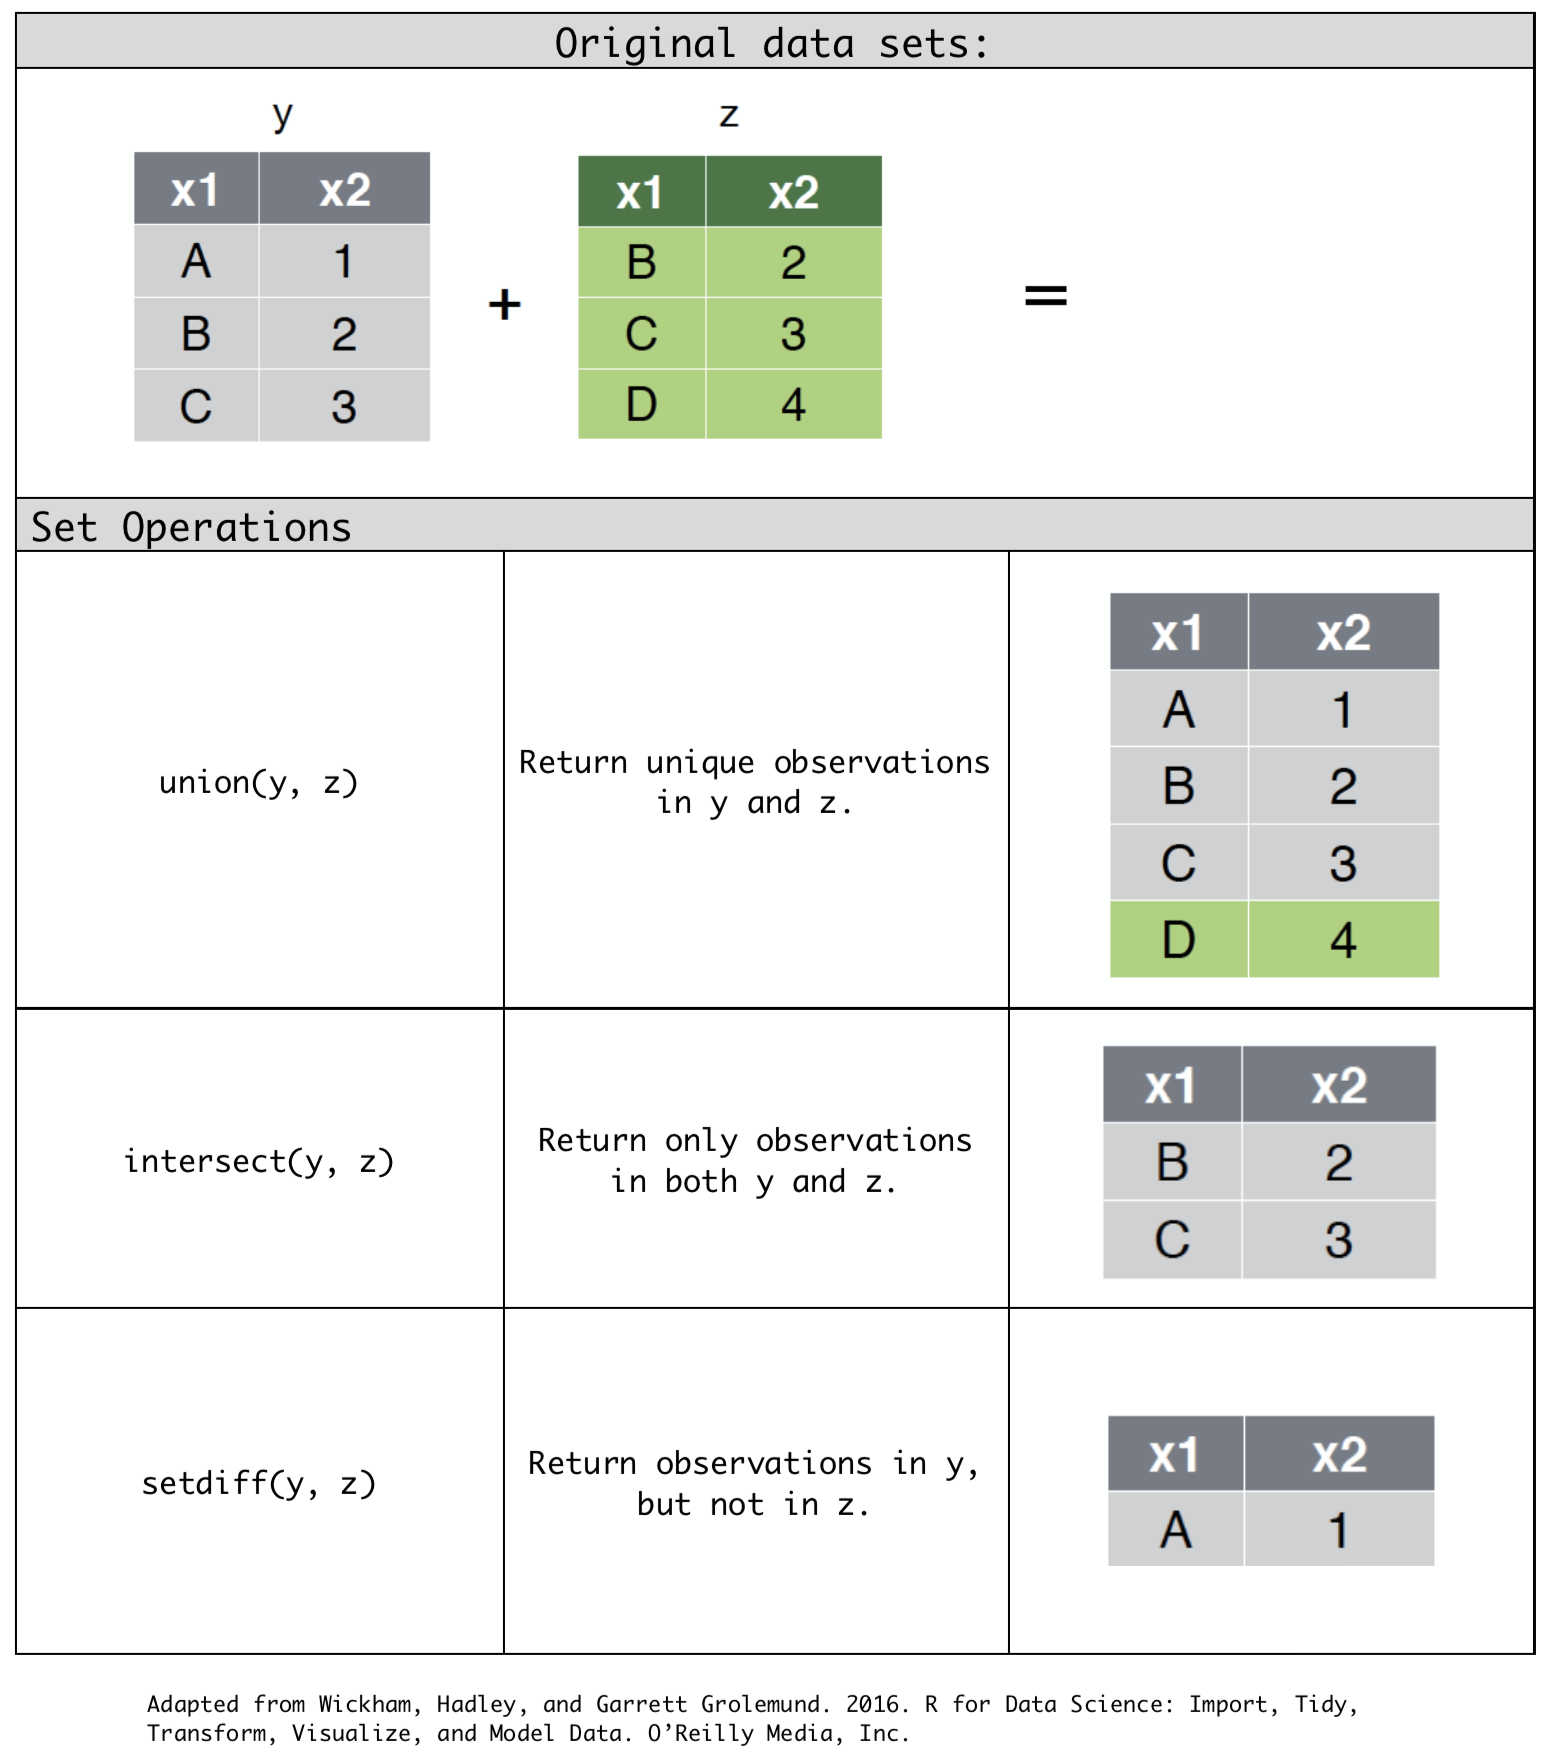
intersect(y, z): return only observations in both y and z.union(y, z): return unique observations in y and z.setdiff(y, z): return observations in y, but not in z.
Merging data sets
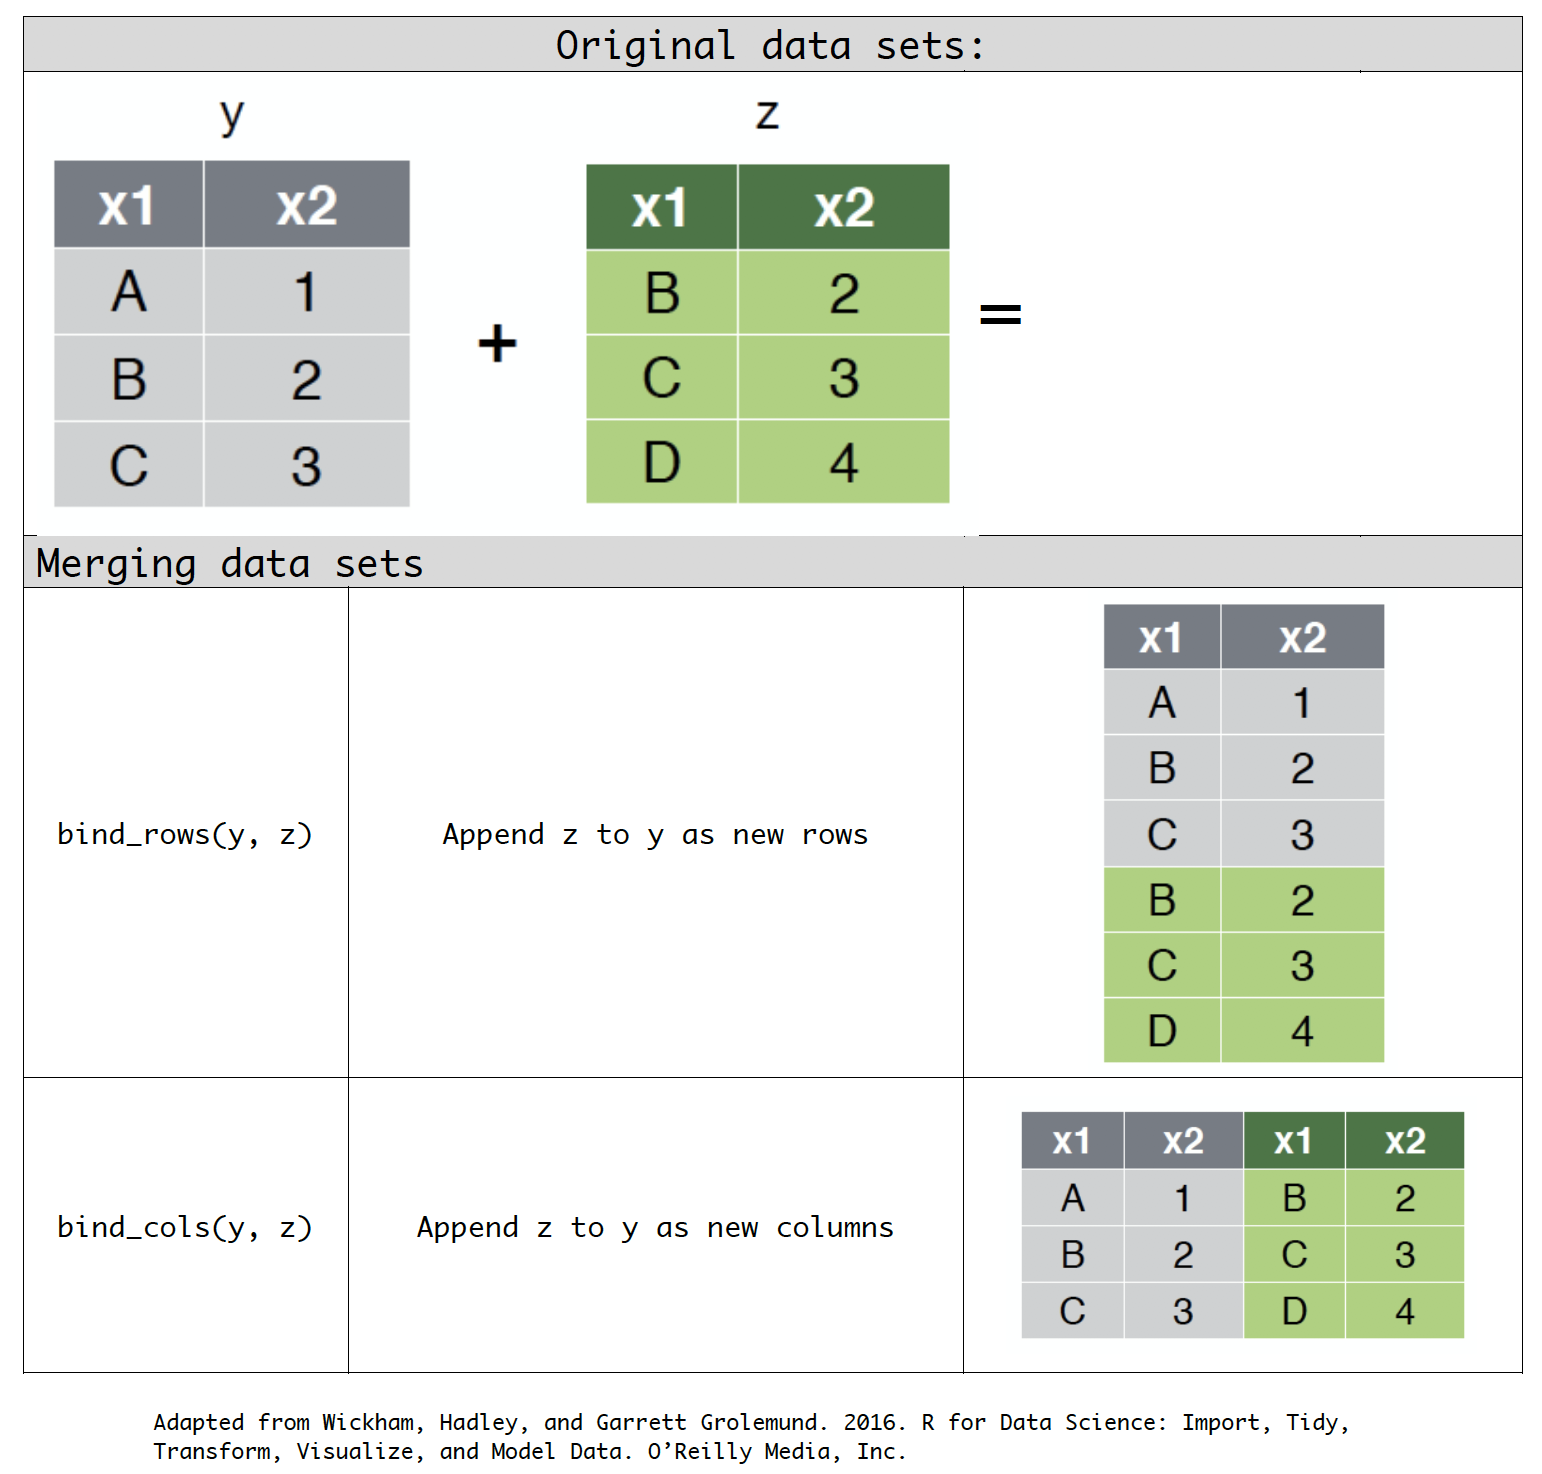
bind_rows(y, z): Append z to y as new rows.bind_cols(y, z): Append z to y as new columns.
Functions to Remember for Week 5 (dplyr)
- Practice!
Worksheet questions:

- Complete the following worksheet:
- Once completed, feel free to work on your Assessments.